Goal
Predicting forest cover type from cartographic variables only (no remotely sensed data).
The Data
This is a dataset from UCI repository. The actual forest cover type for a given observation (30 x 30 meter cell) was determined from US Forest Service (USFS) Region 2 Resource Information System (RIS) data. Independent variables were derived from data originally obtained from US Geological Survey (USGS) and USFS data. Data is in raw form (not scaled) and contains binary (0 or 1) columns of data for qualitative independent variables (wilderness areas and soil types).
The study area included four wilderness areas found in the Roosevelt National Forest of northern Colorado. A total of twelve cartographic measures were utilized as independent variables in the predictive models, while seven major forest cover types were used as dependent variables. Several subsets of these variables were examined to determine the best overall predictive model.
Feature information
-
Elevation in meters
-
Aspect in degrees azimuth
-
Slope in degrees
-
Horizontal distance to nearest surface water features
-
Vertical distance to nearest surface water features
-
Horizontal distance to nearest roadway
-
Horizontal distance to nearest wildfire ignition points
-
Hillshade index at 9am, summer solstice
-
Hillshade index at noon, summer solstice
-
Hillshade index at 3pm, summer solstice
-
Wilderness area designation (4 binary columns)
-
Soil Type designation (40 binary columns)
Target information
- Forest Cover Type designation
Data Cleaning and Feature Engineering
Our Data is recorded observation with no null values. Two features( Wilderness area and Soil type),which are the binary columns, spanning 44 columns instead of two. Bringing the 44 columns down to 2 columns made model perform better.
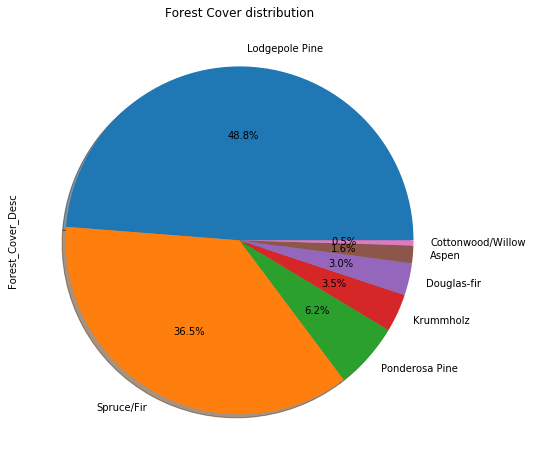
Baseline prediction
Simply predicting the most frequently found tree gives under 50%. we need to engineer a model that beats the baseline accuracy
Types of trees that cover the forest
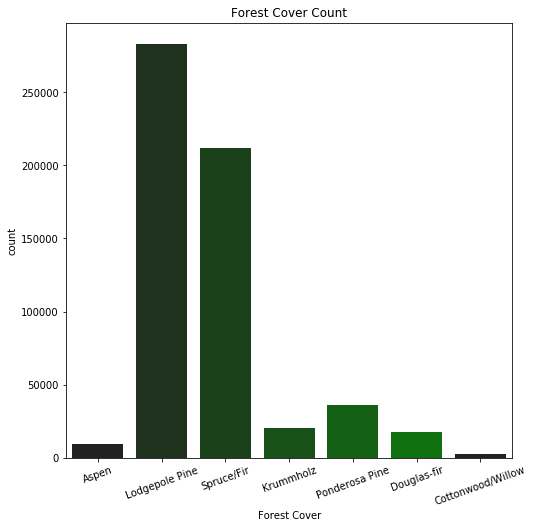
Distribution of trees that cover the forest
Data Exploration
Single Feature
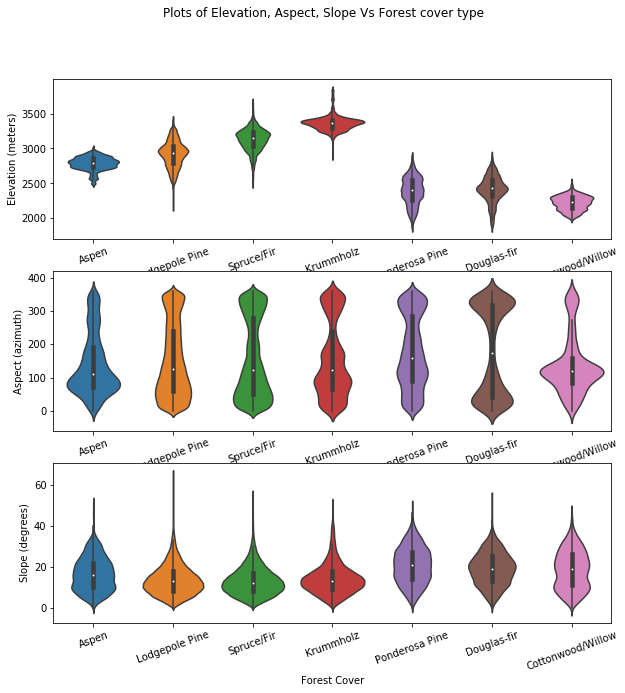
Elevation, Aspect, Slope Vs Forest Cover
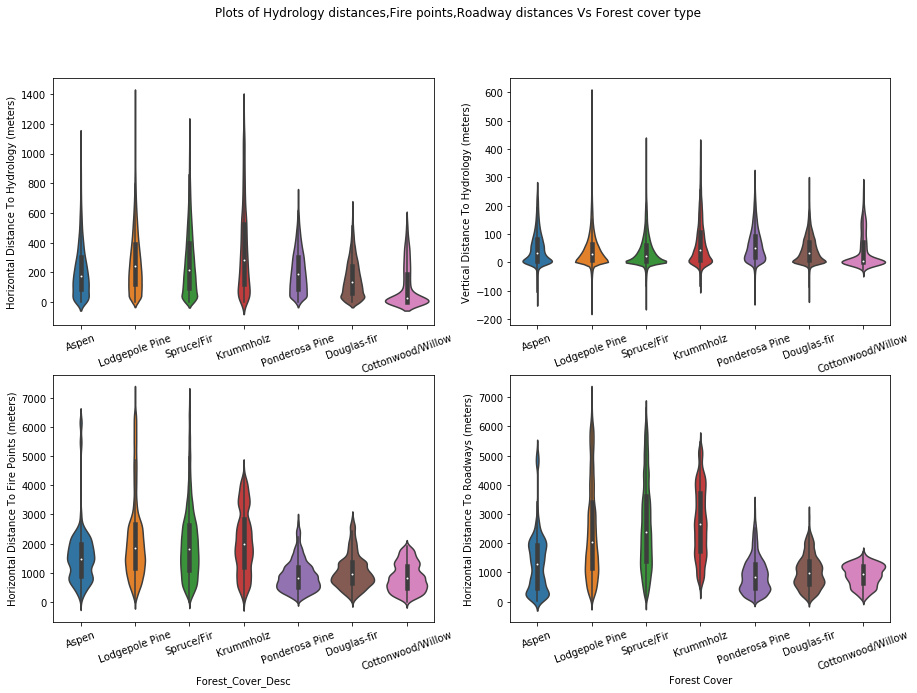
Hydrology distances, fire point distances, roadway distances Vs Forest Cover
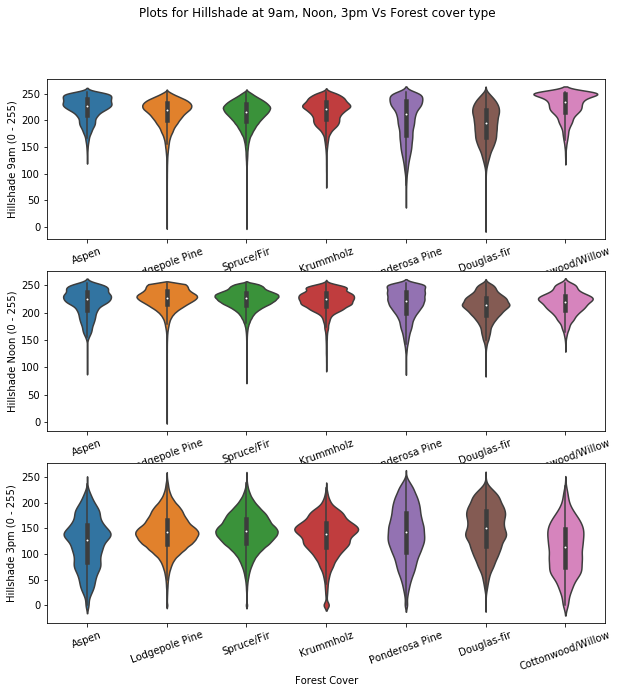
HillShade at 9 am , Noon, 3 pm Vs Forest Cover
Two Features
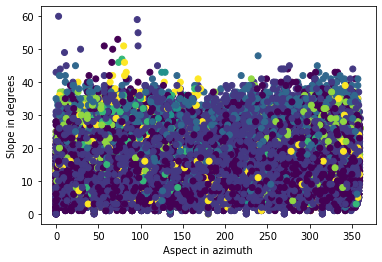
Aspect, Slope for Forest Cover
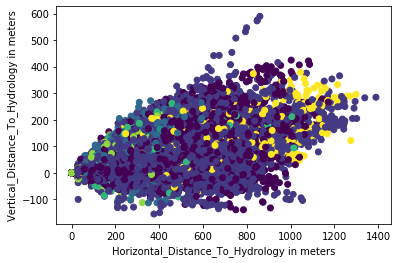
Hydrology distances for Forest Cover
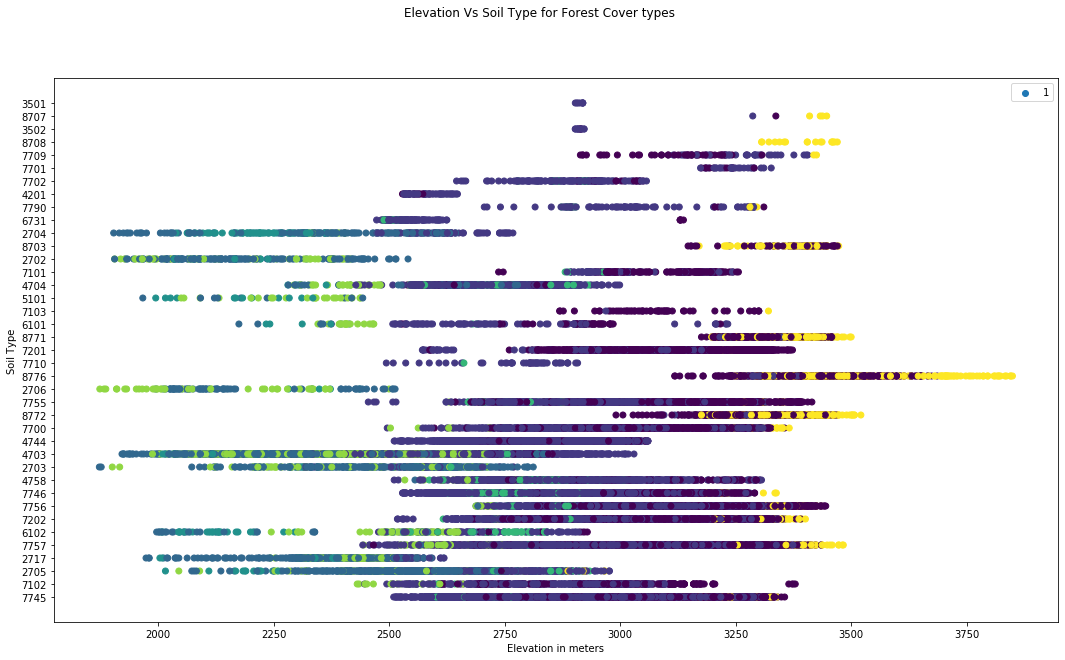
Elevation vs Soil type for Forest Cover
Selection of the model
I could not draw any conclusion by the data exploration. So tried accuracy score using
-
Decision Tree model (81%)
-
Random Forest Classifier model (88.2%)
-
XGBoost Classifier (73.8%)
Its evident that Random Forest Classifier topped the list.
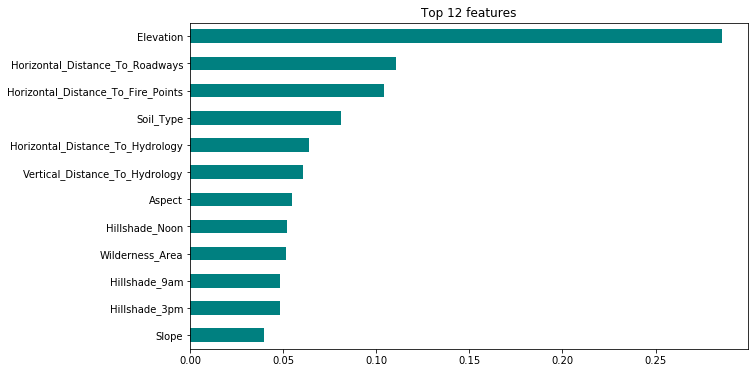
Feature importances
Top 12 features
Feature Importances with weights
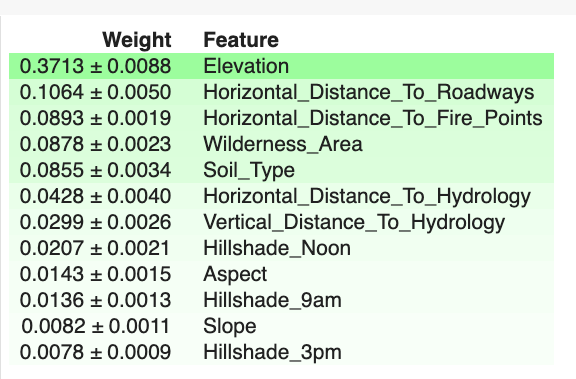
Score improved by a percent using the top 8 features.
Summary
For each subset of cartographic variables examined in this study, relative classification accuracies indicate that, the Random Forest Classifier with top 8 features, performed better compared to the other models in predicting forest cover types.